Introduction
Our team is focused on enhancing user engagement and expanding our reach to a larger audience. One of the most effective ways to achieve this is through a well-designed mobile application, which already has millions of downloads.
Within the app, there is a dynamic carousel on the home page that displays banners. These banners serve multiple purposes, including providing information, facilitating communication, and highlighting key features of the app. Since this is the first page users see after registering, it plays a critical role in shaping their experience and guiding their interactions. A portion of users engage with these banners, while others explore the app through different paths.
Our goal is to better understand user engagement patterns—identifying what drives some users to interact with banners while others take different routes. By analyzing these behaviors, we aim to refine the user experience and optimize engagement within the app.
Problem statement
The goal was to increase user engagement within the app by understanding user’s interest in a variety of banners and then leverage the results across the app.
we didn’t have existing data about user interaction with the app neither did we have enough time at hand to perform that activity. We were also looking at an incoming huge inflow of new users expected in near future due to the planned marketing campaigns. We were essentially looking at a cold start problem to improve engagement since, we would know little about the new users and time to market was a very important factor. We were expected to go live within two weeks duration with a solution to make the best out of data available at hand.
Solution
Bayesian bandits with Thomson sampling ticked all boxes as follows: 1. It requires no data or less to start with compared to other options 2. It will learn incoming users/data and start recommending banners 3. Can work with new banners configured as new arms
The next phase of the project was also discussed where we agreed to work on building contextual bandits. In this post, I will be talking more about how we used various tools and technology making deployment possible. I will not be talking about how the recommendation algorithm works and the technology stack used to achieve it.
Deployment
The build and deployment part of the project was broken down into two technical stages/phases: 1. Testing model and documenting results in the pre-prod environment with production data, define the input and the output schema for the model which will be used by the data engineer team to create a streaming pipeline. 2. Setup model to consume a live stream of event data, and respond via a REST endpoint with the recommended list of banners for the users
The front end of the mobile app is configured for a response time of one second w.r.t to back-end. It meant that the app will try to generate dynamic banners on the user screen based on our recommendations or fall back to static banners if we failed to deliver a response within a second, which added another layer of complexity to the second stage. Our APIs were expected to support a wide range of user load starting from a few hundred requests to millions across the region.
We could list the deployment infra into three major components: 1. A robust build and deployment pipeline 2. Automated performance testing 3. Production monitoring and alerting
Tools
Tools used for the complete setup: 1. Jenkins 2. Artifactory 3. Docker 4. Aquasec image scanning 5. Fortify static code scan 6. Sonar Nexus open source code scanning 7. Kubernetes 8. Predator 9. Prometheus 10. Grafana 11. Bitbucket
Our application solution is a bunch of docker images which consumes/produces content in Kafka topics.
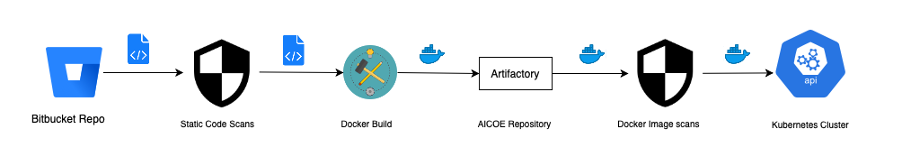
Step 1 — Fetching code and checking for changes
Our pipeline starts at fetching the code from Bitbucket repository. We store code in the folder structure for the 4 different docker images that are to be built. We check whether a file has been changed before initiating build for the files in that folder. The code in the Jenkins pipeline is as below for one of the folders titled ‘generator’.
//hide_output
script{
    GIT_RESULT = sh(script: '''git diff --quiet HEAD \"$(git rev-parse @~1)\" -- generator''',
        returnStatus: true
        )
        echo \"GIT RESULT -- ${GIT_RESULT} -- ${params.branchname}\"
}
Step 2 - Fortify
Next step is to run complete code static security scanning by Fortify
//hide_output
sh '''
  echo \"==================================================\"
  echo \"========--- SAST - Fortify Scan: Start ---========\"
  echo \"==================================================\"
  hostname
  whoami
  ls -ahl
  echo 'WORKSPACE: ' $WORKSPACE
  cd $WORKSPACE
  pwd
  sourceanalyzer -v
  sourceanalyzer -b ${fortify_app_name} -clean
  sourceanalyzer -b ${fortify_app_name} -python-version ${python_version} -python-path ${python_path} ${fortify_scan_files}
  sourceanalyzer -b ${fortify_app_name} -scan -f ${fortify_app_name}.fpr
  fortifyclient -url https://sast.intranet.asia/ssc -authtoken \"${fortify_upload_token}\" uploadFPR -file ${fortify_app_name}.fpr -project ${fortify_app_name} -version ${fortify_app_version}
'''
Step 3 - Docker
The next step is to build the docker image. We first login to Artifactory before initiating the build as our pip libraries are also pulled from mirrored pip in the Artifactory. I have provided a sample of code on how we achieve this.
//hide_output
sh """
    echo ${ARTIFACTORY_PASSWORD} | docker login -u ${ARTIFACTORY_USERNAME} --password-stdin docker-registry:8443
    cd generator
    docker build --file Docker-dev \\
     --build-arg HTTPS_PROXY=http://ip-address \\
     --build-arg ARTIFACTORY_USERNAME=${ARTIFACTORY_USERNAME} \\
     --build-arg ARTIFACTORY_PASSWORD=${ARTIFACTORY_PASSWORD} \\
     -t ${env.generator_image_latest} .
    docker tag ${env.generator_image_latest} ${env.generator_image_name}
    docker push ${env.generator_image_latest}
    docker push ${env.generator_image_name}
    docker logout docker-repo-path
    cd ..
"""
Step 4 - Aquasec
After pushing an image into Artifactory, the next important and mandatory step to be performed is docker image security scanning.
//hide_output
sh """
     echo \"==================================================\"
     echo \"=============--- OSS - Nexus Scan ---=============\"
     echo \"==================================================\"
            docker save -o generator-dev.tar ${env.generator_image_latest}
            """
            String result = nexusscan(\"pcaaicoeaipulsenudgesgeneratordev\", \"$WORKSPACE\", \"build\");
            echo result;
            sh """
            rm -f generator-dev.tar
            """
            sh """
            echo \"==================================================\"
            echo \"=============--- CSEC - Aquasec Scan ---==========\"
            echo \"==================================================\"
"""
            aquasecscan(\"${env.generator_image_latest}\")
The code and image security scanning stages are major milestones to be cleared during the deployment phase. It is important as well as difficult to explain and agree between application security teams about what risks are we willing to take while allowing open source libraries with bugs to go live in our environment.
Step 5 — Kubernetes
Now we move on to the stage where we will be able to actually deploy and run our images. In order to deploy our solution, we need a Redis DB and Kafka cluster up and running. We deploy our docker images using the below code:
//hide_output
sh '''
    set +x
    echo \"---- preparing options ----\"
    export HTTPS_PROXY=ip-address:8080
    export KUBE_NAMESPACE=\"internal-namespace\"
    export KC_OPTS=${KC_OPTS}\" --kubeconfig=${KUBE_CONFIG}\"
    export KC_OPTS=${KC_OPTS}\" --insecure-skip-tls-verify=true\"
    export KC_OPTS=${KC_OPTS}\" --namespace=${KUBE_NAMESPACE}\"

    echo \"---- prepared options ----\"
    echo \"---- preparing alias ----\"
    alias kc=\"kubectl ${KC_OPTS} $*\"
    echo \"---- alias prepared ----\"

    echo \"---- applying manifest ----\"

   kc apply -f configmap.yaml

   if [ $which_app = \"generator\" ];then
     if [ $image_version = \"latest\" ];then
       kc delete deploy ai-pulse-nudges-events-reader||echo
     fi
     sed -i \"s!GENERATOR_VERSION!$image_version!g\" \"generator.yaml\"
     kc apply -f generator.yaml
   fi

   if [ $which_app = \"aggregator\" ];then
     if [ $image_version = \"latest\" ];then
       kc delete deploy ai-pulse-nudges-click-counter||echo
     fi
     sed -i \"s!AGGREGATOR_VERSION!$image_version!g\" \"aggregator.yaml\"
     kc apply -f aggregator.yaml
   fi

   if [ $which_app = \"detector\" ];then
     if [ $image_version = \"latest\" ];then
       kc delete deploy ai-pulse-nudges-engine||echo
     fi
     sed -i \"s!DETECTOR_VERSION!$image_version!g\" \"detector.yaml\"
     kc apply -f detector.yaml
   fi

   if [ $which_app = \"restapi\" ];then
     if [ $image_version = \"latest\" ];then
       kc delete deploy ai-pulse-nudges-restapi||echo
        fi
     sed -i \"s!REST_VERSION!$image_version!g\" \"restapi.yaml\"
     kc apply -f restapi.yaml
            fi
    if [ $which_app = \"all\" ];then
     if [ $image_version = \"latest\" ];then
     kc delete deploy ai-pulse-nudges-events-reader||echo
     kc delete deploy ai-pulse-nudges-click-counter||echo
     kc delete deploy ai-pulse-nudges-engine||echo
     kc delete deploy ai-pulse-nudges-restapi||echo
     fi

     sed -i \"s!GENERATOR_VERSION!$image_version!g\" \"generator.yaml\"
     sed -i \"s!AGGREGATOR_VERSION!$image_version!g\" \"aggregator.yaml\"
     sed -i \"s!DETECTOR_VERSION!$image_version!g\" \"detector.yaml\"
     sed -i \"s!REST_VERSION!$image_version!g\" \"restapi.yaml\"

     kc apply -f generator.yaml
     kc apply -f aggregator.yaml
     kc apply -f detector.yaml
     kc apply -f restapi.yaml
            fi


    echo \"---- manifest applied ----\"
    echo \"---- checking result ----\"

    echo \" >> Deployments \"
    kc get deployments

    echo \" >> Services\"
    kc get svc

    echo \" >> Ingress\"
    kc get ingress

    echo \" >> Pods\"
    kc get pods

    echo \"---- Done ----\"
'''
Step 6 — Performance test
We deploy Predator — the tool which we use for performance test.
//hide_output
sh '''
    set +x
    echo \"---- preparing options ----\"
    export HTTPS_PROXY=ip-address:8080
    export KUBE_NAMESPACE=\"internal-namespace\"
    export KC_OPTS=${KC_OPTS}\" --kubeconfig=${KUBE_CONFIG}\"
    export KC_OPTS=${KC_OPTS}\" --insecure-skip-tls-verify=true\"
    export KC_OPTS=${KC_OPTS}\" --namespace=${KUBE_NAMESPACE}\"

    echo \"---- prepared options ----\"
    echo \"---- preparing alias ----\"
    alias kc=\"kubectl ${KC_OPTS} $*\"
    echo \"---- alias prepared ----\"

    echo \"---- applying manifest ----\"

   kc get deploy|grep predator|awk '{print $1 }' || echo
   kc get deploy|grep predator|awk '{print $1 }'|xargs kc delete deploy || echo

   for i in `seq $replica_count`
   do
     echo $i
     cp -rf predator/predator.yaml tmp.yaml
     sed -i \"s!REPLICA_NO!$i\"\"!g\" \"tmp.yaml\"
     kc apply -f tmp.yaml
   done


    # kc apply -f predator/predator.yaml

    echo \"---- manifest applied ----\"
    echo \"---- checking result ----\"

    echo \" >> Deployments \"
    kc get deployments

    echo \" >> Services\"
    kc get svc

    echo \" >> Ingress\"
    kc get ingress

    echo \" >> Pods\"
    kc get pods

    echo \"---- Done ----\"
'''
Predator is an amazing tool that enables us to leverage existing Kubernetes infra for an unlimited number of users for testing. Read more about the tool here: https://medium.com/zooz-engineering/by-niv-lipetz-software-engineer-zooz-b5928da0b7a8 We leverage the existing enterprise Prometheus and Grafana set up to monitor the application pods.
Lessons learned for next time:
- We started writing the pipeline code from scratch, whereas it would have helped save time if an advanced hello world type of empty pipeline existed, which could be used as a template structure. It would have enabled us to know what credentials and access were required at what stage.
- There were many credentials and access that were required to get the pipeline up and running. It would be a time and effort savior if we have one master service id created and assigned to a pipeline which can then be used across all tools in the organization.
- It is very difficult to build a machine learning model, and real-time streaming data was an additional complexity, but productionizing that model with streaming data is many folds difficult.
Contributors
Glenn Bayne, Tien Nguyet Long, John Yue, Zeldon Tay (郑育忠), Steven Chau , Denys Pang , Philipp Gschoepf , Syam Bandi , Uma Maheshwari, Michael Natusch